Is it true that creating the index is quicker than running the query you needed it for? Let me show you the answer
Tonight, Ladies and Gentlemen, we have one of the most expected fights in SQL Server!! Yeeeeeah!! Booooohhhh!!! (People cheering and booing)
Hm, now seriously, I just read a comment in a blog post called Indexes Helping Indexes and one user wondered why creating an index is always faster than running the same SELECT statement.
My immediate thought was that cannot be true, but I need to prove it!
For these cases where I need a slightly longer running query, I use the big version of AdventureWorks, you can find it in Adam Machanic’s blog.
I will create one index on [dbo].[bigTransactionHistory] and then create an index using the same columns and sorting
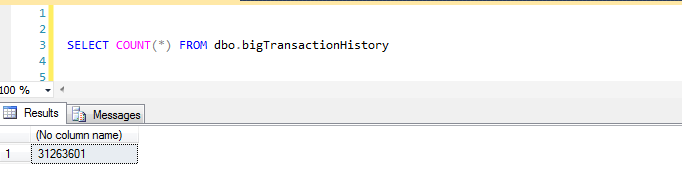
First things first, here is the table, about 31M rows.
To be fair to both opponents, I will do a little trick to get all data into cache, so both will benefit from not having to go disk to read it. (You’ll see it later)
Now I can create the index
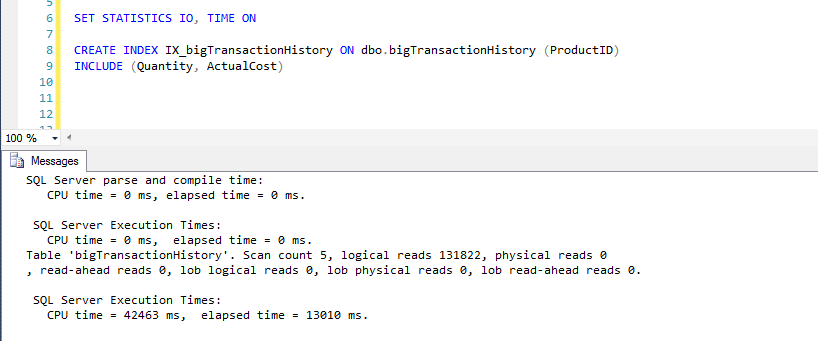
You can see that all reads are logical, no physical, no read aheads, hence no disk is involved. About 13 seconds
Now let’s run the query again and see what happens
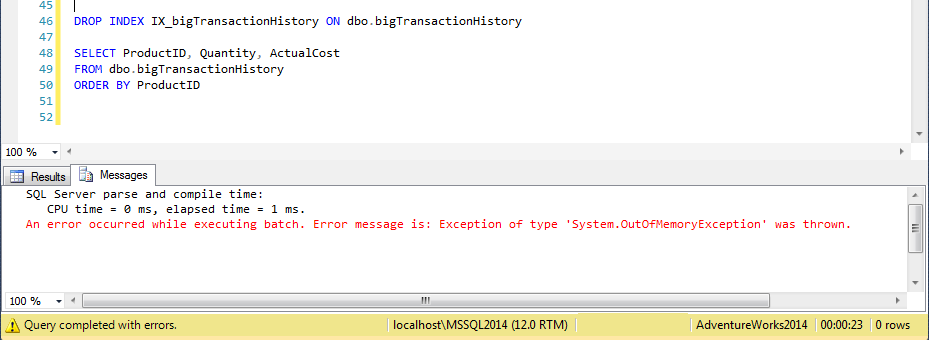
BOOM! My system is not so bad… i7 16GB RAM, SSD … true that I keep opening new tabs everywhere, but… It really did take longer, 13 secs for CREATE INDEX vs Crashing after 23 secs.
He might be right… a query takes longer than index creation. Let’s try a little trick before giving up
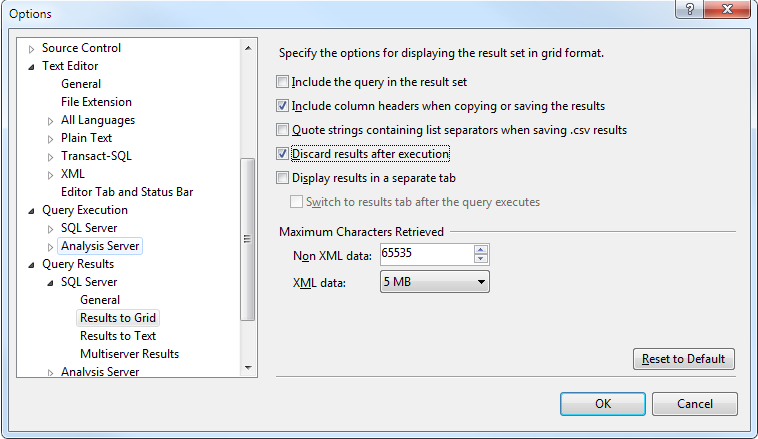
And run the query again in a new window (IMPORTANT!!)

That’s more like it! Obviously there are no results as we requested, not even STATISTICS, but we can see that numbers (10 vs 13 secs) are pretty similar (~ish) if not lower than CREATE INDEX as it actually does less.
The reason is very simple, SSMS is pretty SLOOOOOOW and processes rows 1 by 1 so it consumes a lot time before it finishes displaying them in the default grid. Since CREATE INDEX happens internally, we have the illusion that is faster, but it’s only faster displaying the results.
This trick is very useful together with stopping “Display Actual Execution Plan” (As Erik Darling points) to tune queries as probably SSMS will not be the final user application, so removing the time to display the results will give you a better idea of how long the query really takes.
Hope you enjoyed reading and feel free to comment here or in the original post
What i never understand is why SQL Profile shows time, CPU, reads and writes for query + execution plan drawings, even if drawings itself happen on the client side? I know that showing XML query statistics takes some extra resources, but it could not be that much…
Another funny things that I saw was enabling logging on the SQL driver level, it puts all queries and all results to the text file on the client machine. Imagine how slow it is 🙂
Only trying to imagine is very painful… 🙂
I was taught early in my career, with out being given the reason, that all tuning done in SSMS (it was QA then) should focus on Logical Reads and Number of Scans. The mentor mentioned that time (CPU and Elapsed) and Physical reads could vary significantly due to caching. We did use Profiler for timing and frequently added internal instrumentation (e.g., check point times and events to a #table)
It surprises me that so many DBAs in particular are surprised to find that the tools we use affect the measurements we make.
Absolutely, that’s why I run the query first (secretly) to get all data in the cache, so the CREATE INDEX only does logical reads, same for the second execution of the query.
To put you in the worst case scenario you can always use DBCC DROPCLEANBUFFERS() to flush the cache and have to go disk. Obviously a BAD idea in LIVE systems, but for testing should be ok