One of the most important things when something goes wrong is to have an idea how your environment looks like in a normal day. Let me show you how to easily get your storage tested and get meaningful results that you can store for future reference Last week I’ve been testing some new storage at work to see how it performs and I got to use a [hopefully] well known tool provided by Microsoft called diskspd.exe
Diskspd.exe is great to generate read write activity in a volume (regardless it’s a local disk or coming from a SAN like my case) using different parameters to hammer it in a variety of ways, trying to replicate the multiple ways SQL Server performs IO operations.
** Disclaimer: SAN storage is more complex to test due to the more sophisticated way to serve the data which might include caching and automated tiering. Please check this podcast for more details
In this post I am not going to get into many details about the tool itself, but in how to process the generated output for baselining or benchmarking our storage subsytem.
Background
There are multiple operations that require SQL Server to interact with the underlying storage subsystem and also plenty of misconceptions around it. As for most of the questions related to SQL Server, there is no an absolute truth that applies blindly to each and every case.
I strongly recommend you take a minute to read an article written by the MCM and MVP Argenis Fernandez (b|t) called What is SQL Server’s IO Block Size? to see what I just told you, because that will give you a better understanding of the kind of tests you should be performing to benchmark your storage.
Using real SQL Server block sizes can give us a good idea what our storage can be good at. For instance if we see good read performance but not so good when writing 60k blocks, we can guess that database files with most read activity are good candidates, but the transaction log file is not.
Using diskspd
There are lots of articles and posts explaining how to use this tool, so I’d rather point you there and only take a sample to show you how to process it.
The most complete documentation is here and some articles from Jeremiah Peschka and Glenn Berry will help you too to hit the ground running.
In my example I would be testing the suitability of a disk for storing my backups. So what I would run looks like
F:\Diskspd\amd64fre>diskspd.exe -b1M -d60 -o32 -h -L -t8 -W -w100 -Rxml F:\temp\test.dat > F:\20170302_Wite_1MB_8th_1file.xml
See how I chose the parameter to match with I believe would be the most similar to SQL Server activity, in this case the block size is 1MB, only writes, 8 threads and 1 target file. You can tweak it to match your specifics, but as example I guess this is sufficient.
Processing diskspd output
Another great thing of diskspd is that you can get the output in different formats, but for processing purposes I prefer the XML format, because at the end of the day, everybody loves querying XML, especially in SQL 🙂
And that’s the goal of this post, to show you how to easily parse the XML output in a way we can keep in a database for future reference. So let’s roll our sleeves and get to work. I mean me, not you that only have to copy paste this to make it happen.
The hack
Coming from a development background, I just love writing code, so this is what I came up with after getting bored of looking to a few txt output files.
USE master;
GO
IF OBJECT_ID('dbo.sqlg_ParseDiskskpXml') IS NULL EXECUTE sp_executesql N'CREATE PROCEDURE dbo.sqlg_ParseDiskskpXml AS RETURN';
GO
SET ANSI_NULLS ON;
GO
SET QUOTED_IDENTIFIER ON;
GO
-- =============================================
-- Author:		Raul Gonzalez @SQLDoubleG
-- Create date: 26/02/2017
-- Description:	Process XML output file of diskspd.exe
--
-- Parameters:
--              - @filePath		-> Full path of the file that contains the XML output of diskspd.exe
--              - @simplified   -> will return just one row with general info and IO totals, including IOps, throughput and latency for Reads and Writes.
--
-- Log:
--				26/02/2017	RAG	- Created
--
-- Copyright:   (C) 2017 Raul Gonzalez (@SQLDoubleG https://sqldoubleg.live-website.com)
--
--              THIS CODE AND INFORMATION ARE PROVIDED "AS IS" WITHOUT WARRANTY OF
--              ANY KIND, EITHER EXPRESSED OR IMPLIED, INCLUDING BUT NOT LIMITED
--              TO THE IMPLIED WARRANTIES OF MERCHANTABILITY AND/OR FITNESS FOR A
--              PARTICULAR PURPOSE.
--
--              THE AUTHOR SHALL NOT BE LIABLE TO YOU OR ANY THIRD PARTY FOR ANY INDIRECT,
--              SPECIAL, INCIDENTAL, PUNITIVE, COVER, OR CONSEQUENTIAL DAMAGES OF ANY KIND
--
--              YOU MAY ALTER THIS CODE FOR YOUR OWN *NON-COMMERCIAL* PURPOSES. YOU MAY
--              REPUBLISH ALTERED CODE AS LONG AS YOU INCLUDE THIS COPYRIGHT AND GIVE DUE CREDIT.
--
-- =============================================
ALTER PROCEDURE dbo.sqlg_ParseDiskskpXml
	@filePath		NVARCHAR(512)
	, @simplified	BIT = 1

AS
BEGIN

SET NOCOUNT ON;

DECLARE @xml XML;
DECLARE @sql NVARCHAR(1000) = N'SET @xml = (SELECT CONVERT(XML, BulkColumn) FROM OPENROWSET(BULK ''' + @filePath + ''', SINGLE_BLOB) AS x);';

EXECUTE sys.sp_executesql @sql, N'@xml XML OUTPUT', @xml = @xml OUTPUT;

IF OBJECT_ID('tempdb..#SystemInfo')			IS NOT NULL DROP TABLE #SystemInfo;
IF OBJECT_ID('tempdb..#RunningParameters')	IS NOT NULL DROP TABLE #RunningParameters;
IF OBJECT_ID('tempdb..#RunningValues')		IS NOT NULL DROP TABLE #RunningValues;
IF OBJECT_ID('tempdb..#TimeSpan')			IS NOT NULL DROP TABLE #TimeSpan;
IF OBJECT_ID('tempdb..#ProcessorUsage')		IS NOT NULL DROP TABLE #ProcessorUsage;
--IF OBJECT_ID('tempdb..#AverageLatency')		IS NOT NULL DROP TABLE #AverageLatency
IF OBJECT_ID('tempdb..#LatencyPercentiles')	IS NOT NULL DROP TABLE #LatencyPercentiles;
IF OBJECT_ID('tempdb..#ResultsPerThread')	IS NOT NULL DROP TABLE #ResultsPerThread;

--===========================================================================================
-- Info contained in <Results><System>
--===========================================================================================
SELECT @xml.value('(/Results/System/ComputerName)[1]', 'VARCHAR(128)') AS computerName
		, @xml.value('(/Results/System/RunTime)[1]', 'VARCHAR(30)') AS RunTime
		, @xml.value('(/Results/System/ProcessorTopology/Group/@ActiveProcessors)[1]', 'TINYINT') AS ActiveProcessors
INTO #SystemInfo;
--===========================================================================================
-- Info contained in <Results><Profile><TimeSpans><TimeSpan>
--===========================================================================================
SELECT t.c.value('(./TimeSpan/CompletionRoutines)[1]', 'VARCHAR(5)') AS CompletionRoutines
		, t.c.value('(./TimeSpan/MeasureLatency)[1]', 'VARCHAR(5)') AS MeasureLatency
		, t.c.value('(./TimeSpan/CalculateIopsStdDev)[1]', 'VARCHAR(5)') AS CalculateIopsStdDev
		, t.c.value('(./TimeSpan/DisableAffinity)[1]', 'VARCHAR(5)') AS DisableAffinity
		, t.c.value('(./TimeSpan/Duration)[1]', 'INT') AS Duration
		, t.c.value('(./TimeSpan/Warmup)[1]', 'INT') AS Warmup
		, t.c.value('(./TimeSpan/Cooldown)[1]', 'INT') AS Cooldown
		, t.c.value('(./TimeSpan/ThreadCount)[1]', 'TINYINT') AS ThreadCount
		, t.c.value('(./TimeSpan/IoBucketDuration)[1]', 'INT') AS IoBucketDuration
		, t.c.value('(./TimeSpan/RandSeed)[1]', 'INT') AS RandSeed
		--,  t.c.query('.') AS CompletionRoutines
INTO #RunningParameters
FROM @xml.nodes('/Results/Profile/TimeSpans') AS t(c);
--===========================================================================================
-- Info contained for each <Target> in <Results><Profile><TimeSpans><TimeSpan><Targets>
--===========================================================================================
SELECT t2.d.value('(./Path)[1]', 'VARCHAR(512)') AS Path
		, t2.d.value('(./BlockSize)[1]', 'VARCHAR(512)') AS BlockSize
		, t2.d.value('(./BaseFileOffset)[1]', 'VARCHAR(512)') AS BaseFileOffset
		, t2.d.value('(./SequentialScan)[1]', 'VARCHAR(512)') AS SequentialScan
		, t2.d.value('(./RandomAccess)[1]', 'VARCHAR(512)') AS RandomAccess
		, t2.d.value('(./TemporaryFile)[1]', 'VARCHAR(512)') AS TemporaryFile
		, t2.d.value('(./UseLargePages)[1]', 'VARCHAR(512)') AS UseLargePages
		, t2.d.value('(./DisableOSCache)[1]', 'VARCHAR(512)') AS DisableOSCache
		, t2.d.value('(./WriteThrough)[1]', 'VARCHAR(512)') AS WriteThrough
		--, d.value('(./WriteBufferContent>'
		--, d.value('(./Pattern>sequential</Pattern>'
		--, d.value('(.//WriteBufferContent>'
		, t2.d.value('(./ParallelAsyncIO)[1]', 'VARCHAR(512)') AS ParallelAsyncIO
		, t2.d.value('(./StrideSize)[1]', 'VARCHAR(512)') AS StrideSize
		, t2.d.value('(./InterlockedSequential)[1]', 'VARCHAR(512)') AS InterlockedSequential
		, t2.d.value('(./ThreadStride)[1]', 'VARCHAR(512)') AS ThreadStride
		, t2.d.value('(./MaxFileSize)[1]', 'VARCHAR(512)') AS MaxFileSize
		, t2.d.value('(./RequestCount)[1]', 'VARCHAR(512)') AS RequestCount
		, t2.d.value('(./WriteRatio)[1]', 'VARCHAR(512)') AS WriteRatio
		, t2.d.value('(./Throughput)[1]', 'VARCHAR(512)') AS Throughput
		, t2.d.value('(./ThreadsPerFile)[1]', 'VARCHAR(512)') AS ThreadsPerFile
		, t2.d.value('(./IOPriority)[1]', 'VARCHAR(512)') AS IOPriority
INTO #RunningValues
FROM @xml.nodes('/Results/Profile/TimeSpans/TimeSpan/Targets/Target') AS t2(d);
--===========================================================================================
-- Info contained in <Results><TimeSpan>
--===========================================================================================
SELECT t.c.value('(./TestTimeSeconds)[1]', 'DECIMAL(10,2)') AS TestTimeSeconds
		, t.c.value('(./ThreadCount)[1]', 'SMALLINT') AS ThreadCount
		, t.c.value('(./ProcCount)[1]', 'SMALLINT') AS ProcCount
INTO #TimeSpan
FROM @xml.nodes('/Results/TimeSpan') AS t(c);
--===========================================================================================
-- Info contained for each <CPU> in <Results><TimeSpan><CpuUtilization>
--===========================================================================================
SELECT t.c.value('(./Id)[1]', 'TINYINT') AS Id
		, t.c.value('(./UsagePercent)[1]', 'DECIMAL(5,2)') AS UsagePercent
		, t.c.value('(./UserPercent)[1]', 'DECIMAL(5,2)') AS UserPercent
		, t.c.value('(./KernelPercent)[1]', 'DECIMAL(5,2)') AS KernelPercent
		, t.c.value('(./IdlePercent)[1]', 'DECIMAL(5,2)') AS IdlePercent
INTO #ProcessorUsage
FROM @xml.nodes('/Results/TimeSpan/CpuUtilization/CPU') AS t(c);
--===========================================================================================
-- Info contained in <Results><TimeSpan><Latency>, this can be calculated from the details too, so skip it
--===========================================================================================
--SELECT t.c.value('(./AverageReadMilliseconds)[1]', 'DECIMAL(10,2)') AS AverageReadMilliseconds
--		, t.c.value('(./ReadLatencyStdev)[1]', 'DECIMAL(10,2)') AS ReadLatencyStdev
--		, t.c.value('(./AverageWriteMilliseconds)[1]', 'DECIMAL(10,2)') AS AverageWriteMilliseconds
--		, t.c.value('(./WriteLatencyStdev)[1]', 'DECIMAL(10,2)') AS WriteLatencyStdev
--		, t.c.value('(./AverageTotalMilliseconds)[1]', 'DECIMAL(10,2)') AS AverageTotalMilliseconds
--		, t.c.value('(./LatencyStdev)[1]', 'DECIMAL(10,2)') AS LatencyStdev
--INTO #AverageLatency
--FROM @xml.nodes('/Results/TimeSpan/Latency') AS t(c)
--===========================================================================================
-- Info contained for each <Bucket> in <Results><TimeSpan><Latency>
--===========================================================================================
SELECT t.c.value('(./Percentile)[1]', 'DECIMAL(15,7)') AS Percentile
		, t.c.value('(./ReadMilliseconds)[1]', 'DECIMAL(10,4)') AS ReadMilliseconds
		, t.c.value('(./WriteMilliseconds)[1]', 'DECIMAL(10,4)') AS WriteMilliseconds
		, t.c.value('(./TotalMilliseconds)[1]', 'DECIMAL(10,4)') AS TotalMilliseconds
INTO #LatencyPercentiles
FROM @xml.nodes('/Results/TimeSpan/Latency/Bucket') AS t(c);
--===========================================================================================
-- Info contained for each <Thread> in <Results><TimeSpan><Latency>
--===========================================================================================
SELECT t.c.value('(./Id)[1]', 'INT') AS ThreadId
		, t.c.value('(./Target/Path)[1]', 'VARCHAR(512)') AS Path
		, t.c.value('(./Target/BytesCount)[1]', 'BIGINT') AS BytesCount
		, t.c.value('(./Target/FileSize)[1]', 'BIGINT') AS FileSize
		, t.c.value('(./Target/IOCount)[1]', 'BIGINT') AS IOCount
		, t.c.value('(./Target/ReadBytes)[1]', 'BIGINT') AS ReadBytes
		, t.c.value('(./Target/ReadCount)[1]', 'BIGINT') AS ReadCount
		, t.c.value('(./Target/WriteBytes)[1]', 'BIGINT') AS WriteBytes
		, t.c.value('(./Target/WriteCount)[1]', 'BIGINT') AS WriteCount
		, t.c.value('(./Target/AverageReadLatencyMilliseconds)[1]', 'DECIMAL(10,3)') AS AverageReadLatencyMilliseconds
		, t.c.value('(./Target/ReadLatencyStdev)[1]', 'DECIMAL(10,3)') AS ReadLatencyStdev
		, t.c.value('(./Target/AverageWriteLatencyMilliseconds)[1]', 'DECIMAL(10,3)') AS AverageWriteLatencyMilliseconds
		, t.c.value('(./Target/WriteLatencyStdev)[1]', 'DECIMAL(10,3)') AS WriteLatencyStdev
		, t.c.value('(./Target/AverageLatencyMilliseconds)[1]', 'DECIMAL(10,3)') AS AverageLatencyMilliseconds
		, t.c.value('(./Target/LatencyStdev)[1]', 'DECIMAL(10,3)') AS LatencyStdev
INTO #ResultsPerThread
FROM @xml.nodes('/Results/TimeSpan/Thread') AS t(c);


--===========================================================================================
-- Return useful Information
--===========================================================================================
IF @simplified = 1 BEGIN

	SELECT  si.computerName
			, si.RunTime
			, ts.TestTimeSeconds
			, ts.ThreadCount
			, COUNT(DISTINCT th.Path) AS FileCount
			, STUFF(tf.path, 1, 2, '') AS TargetFiles
			, rv.ThreadsPerFile
			, rv.BlockSize
			--th.FileSize / 1024 / 1024 AS [FileSize MB],
			, CONVERT(VARCHAR(3), ( 100 - rv.WriteRatio )) + '/' + CONVERT(VARCHAR(3), rv.WriteRatio) AS [Read/Write Ratio]
			-- Total Read + Writes
			, SUM(th.BytesCount) AS [Total bytes]
			, SUM(th.IOCount) AS [Total I/Os]
			, CEILING(SUM(th.IOCount) / ts.TestTimeSeconds) AS [Total IOps]
			, CONVERT(DECIMAL(15, 2), ROUND(SUM(th.BytesCount) / 1024. / 1024 / ts.TestTimeSeconds, 2)) AS [Total MB/s]
			-- Reads
			, SUM(th.ReadBytes) AS [Read bytes]
			, SUM(th.ReadCount) AS [Read I/Os]
			, CEILING(SUM(th.ReadCount) / ts.TestTimeSeconds) AS [Read IOps]
			, CONVERT(DECIMAL(15, 2), ROUND(SUM(th.ReadBytes) / 1024. / 1024 / ts.TestTimeSeconds, 2)) AS [Read MB/s]
			-- Writes
			, SUM(th.WriteBytes) AS [Write bytes]
			, SUM(th.WriteCount) AS [Write I/Os]
			, CEILING(SUM(th.WriteCount) / ts.TestTimeSeconds) AS [Write IOps]
			, CONVERT(DECIMAL(15, 2), ROUND(SUM(th.WriteBytes) / 1024. / 1024 / ts.TestTimeSeconds, 2)) AS [Write MB/s]
			-- Latency Total
			, CONVERT(DECIMAL(15, 2), ROUND(AVG(ISNULL(th.AverageLatencyMilliseconds, 0)), 2)) AS [AverageLatencyMilliseconds]
			, CONVERT(DECIMAL(15, 2), ROUND(AVG(ISNULL(th.LatencyStdev, 0)), 2)) AS [LatencyStdev]
			-- Latency Read
			, CONVERT(DECIMAL(15, 2), ROUND(AVG(ISNULL(th.AverageReadLatencyMilliseconds, 0)), 2)) AS [AverageReadLatencyMilliseconds]
			, CONVERT(DECIMAL(15, 2), ROUND(AVG(ISNULL(th.ReadLatencyStdev, 0)), 2)) AS [ReadLatencyStdev]
			-- Latency Write
			, CONVERT(DECIMAL(15, 2), ROUND(AVG(ISNULL(th.AverageWriteLatencyMilliseconds, 0)), 2)) AS [AverageWriteLatencyMilliseconds]
			, CONVERT(DECIMAL(15, 2), ROUND(AVG(ISNULL(th.WriteLatencyStdev, 0)), 2)) AS [WriteLatencyStdev]
		FROM #ResultsPerThread AS th
			CROSS JOIN #TimeSpan AS ts
			CROSS JOIN ( SELECT TOP 1 * FROM   #RunningValues) AS rv
			CROSS JOIN #SystemInfo AS si
			CROSS JOIN ( SELECT DISTINCT ', ' + Path + ' (' + CONVERT(VARCHAR(10), FileSize / 1024/ 1024) + 'MB)' AS [text()]
							FROM #ResultsPerThread FOR XML PATH('')) AS tf ( [path] )
		GROUP BY si.computerName
			, si.RunTime
			, ts.TestTimeSeconds
			, ts.ThreadCount
			, rv.ThreadsPerFile
			, rv.BlockSize
			, rv.WriteRatio
			, th.FileSize
			, tf.[path];
END; ELSE BEGIN
	--===========================================================================================
	-- Input parameters
	--===========================================================================================
    SELECT  si.computerName AS [computer name]
			, si.RunTime AS [run time]
			, p.Duration AS [duration]
			, p.Warmup AS [warm up time]
			, p.Cooldown AS [cood down time]
			, p.RandSeed AS [random seed]
			, si.ActiveProcessors
		FROM #RunningParameters AS p
			CROSS JOIN #SystemInfo AS si;

	--===========================================================================================
	-- Time span
	--===========================================================================================
    SELECT  rv.Path
			, rv.BlockSize
			--rv.WriteRatio ,
			, CONVERT(VARCHAR(3), ( 100 - rv.WriteRatio )) + '/' + CONVERT(VARCHAR(3), rv.WriteRatio) AS [Read/Write Ratio]
			, rv.ThreadsPerFile
			, rv.IOPriority
			, rv.BaseFileOffset
			, rv.SequentialScan
			, rv.RandomAccess
			, rv.TemporaryFile
			, rv.UseLargePages
			, rv.DisableOSCache
			, rv.WriteThrough
			, rv.ParallelAsyncIO
			, rv.StrideSize
			, rv.InterlockedSequential
			, rv.ThreadStride
			, rv.MaxFileSize
			, rv.RequestCount
			, rv.Throughput
		FROM #RunningValues AS rv;
	--===========================================================================================
	-- Processor
	--===========================================================================================
    SELECT  Id AS CPU
			, UsagePercent
			, UserPercent
			, KernelPercent
			, IdlePercent
		FROM #ProcessorUsage
	--===========================================================================================
	-- Latency
	--===========================================================================================
	;WITH cte AS(
    SELECT  ISNULL(CONVERT(VARCHAR(5), th.ThreadId), 'Total') AS ThreadId
			, th.Path + ' (' + CONVERT(VARCHAR(10), th.FileSize / 1024 / 1024)
			+ 'MB)' AS [file]
			-- Total Read + Writes
			, ( th.BytesCount ) AS [Total bytes]
			, ( th.IOCount ) AS [Total I/Os]
			, CEILING(( th.IOCount ) / ts.TestTimeSeconds) AS [Total IOps]
			, CONVERT(DECIMAL(15, 2), ROUND(( th.BytesCount ) / 1024. / 1024 / ts.TestTimeSeconds, 2)) AS [Total MB/s]
			-- Reads
			, ( th.ReadBytes ) AS [Read bytes]
			, ( th.ReadCount ) AS [Read I/Os]
			, CEILING(( th.ReadCount ) / ts.TestTimeSeconds) AS [Read IOps]
			, CONVERT(DECIMAL(15, 2), ROUND(( th.ReadBytes ) / 1024. / 1024 / ts.TestTimeSeconds, 2)) AS [Read MB/s]
			-- Writes
			, ( th.WriteBytes ) AS [Write bytes]
			, ( th.WriteCount ) AS [Write I/Os]
			, CEILING(( th.WriteCount ) / ts.TestTimeSeconds) AS [Write IOps]
			, CONVERT(DECIMAL(15, 2), ROUND(( th.WriteBytes ) / 1024. / 1024 / ts.TestTimeSeconds, 2)) AS [Write MB/s]
			-- Latency Total
			, CONVERT(DECIMAL(15, 2), ROUND(( ISNULL(th.AverageLatencyMilliseconds, 0) ), 2)) AS [AverageLatencyMilliseconds]
			, CONVERT(DECIMAL(15, 2), ROUND(( ISNULL(th.LatencyStdev, 0) ), 2)) AS [LatencyStdev]
			-- Latency Read
			, CONVERT(DECIMAL(15, 2), ROUND(( ISNULL(th.AverageReadLatencyMilliseconds, 0) ), 2)) AS [AverageReadLatencyMilliseconds]
			, CONVERT(DECIMAL(15, 2), ROUND(( ISNULL(th.ReadLatencyStdev, 0) ), 2)) AS [ReadLatencyStdev]
			-- Latency Write
			, CONVERT(DECIMAL(15, 2), ROUND(( ISNULL(th.AverageWriteLatencyMilliseconds, 0) ), 2)) AS [AverageWriteLatencyMilliseconds]
			, CONVERT(DECIMAL(15, 2), ROUND(( ISNULL(th.WriteLatencyStdev, 0) ), 2)) AS [WriteLatencyStdev]
		FROM #ResultsPerThread AS th
			CROSS JOIN #TimeSpan AS ts
			CROSS JOIN (SELECT TOP 1 * FROM #RunningValues) AS rv
			CROSS JOIN #SystemInfo AS si
	UNION
	SELECT
			'Total'
			, '-'
			-- Total Read + Writes
			, SUM(th.BytesCount) AS [Total bytes]
			, SUM(th.IOCount) AS [Total I/Os]
			, CEILING(SUM(th.IOCount) / ts.TestTimeSeconds) AS [Total IOps]
			, CONVERT(DECIMAL(15, 2), ROUND(SUM(th.BytesCount) / 1024. / 1024 / ts.TestTimeSeconds, 2)) AS [Total MB/s]
			-- Reads
			, SUM(th.ReadBytes) AS [Read bytes]
			, SUM(th.ReadCount) AS [Read I/Os]
			, CEILING(SUM(th.ReadCount) / ts.TestTimeSeconds) AS [Read IOps]
			, CONVERT(DECIMAL(15, 2), ROUND(SUM(th.ReadBytes) / 1024. / 1024 / ts.TestTimeSeconds, 2)) AS [Read MB/s]
			-- Writes
			, SUM(th.WriteBytes) AS [Write bytes]
			, SUM(th.WriteCount) AS [Write I/Os]
			, CEILING(SUM(th.WriteCount) / ts.TestTimeSeconds) AS [Write IOps]
			, CONVERT(DECIMAL(15, 2), ROUND(SUM(th.WriteBytes) / 1024. / 1024 / ts.TestTimeSeconds, 2)) AS [Write MB/s]
			-- Latency Total
			, CONVERT(DECIMAL(15, 2), ROUND(AVG(ISNULL(th.AverageLatencyMilliseconds, 0)), 2)) AS [AverageLatencyMilliseconds]
			, CONVERT(DECIMAL(15, 2), ROUND(AVG(ISNULL(th.LatencyStdev, 0)), 2)) AS [LatencyStdev]
			-- Latency Read
			, CONVERT(DECIMAL(15, 2), ROUND(AVG(ISNULL(th.AverageReadLatencyMilliseconds, 0)), 2)) AS [AverageReadLatencyMilliseconds]
			, CONVERT(DECIMAL(15, 2), ROUND(AVG(ISNULL(th.ReadLatencyStdev, 0)), 2)) AS [ReadLatencyStdev]
			-- Latency Write
			, CONVERT(DECIMAL(15, 2), ROUND(AVG(ISNULL(th.AverageWriteLatencyMilliseconds, 0)), 2)) AS [AverageWriteLatencyMilliseconds]
			, CONVERT(DECIMAL(15, 2), ROUND(AVG(ISNULL(th.WriteLatencyStdev, 0)), 2)) AS [WriteLatencyStdev]
		FROM #ResultsPerThread AS th
			CROSS JOIN #TimeSpan AS ts
			CROSS JOIN (SELECT TOP 1 * FROM #RunningValues) AS rv
			CROSS JOIN #SystemInfo AS si
		GROUP BY ts.TestTimeSeconds
	)

	SELECT * FROM cte
		ORDER BY CASE WHEN ISNUMERIC(ThreadId) = 0 THEN 999 ELSE CONVERT(INT, ThreadId) END ASC;
	--===========================================================================================
	-- Percentiles
	--===========================================================================================
	SELECT CASE WHEN Percentile = 0				THEN 'min'
				WHEN Percentile = 100			THEN 'max'
				WHEN Percentile = 100			THEN 'max'
				WHEN Percentile % 1 = .9		THEN '3-nines'
				WHEN Percentile % 1 = .99		THEN '4-nines'
				WHEN Percentile % 1 = .999		THEN '5-nines'
				WHEN Percentile % 1 = .9999		THEN '6-nines'
				WHEN Percentile % 1 = .99999	THEN '7-nines'
				WHEN Percentile % 1 = .999999	THEN '8-nines'
				WHEN Percentile % 1 = .9999999	THEN '9-nines'
				ELSE CONVERT(VARCHAR(10), CONVERT(INT, Percentile)) + 'th'
			END AS [%-ile]
			, ISNULL(CONVERT(VARCHAR(10), ReadMilliseconds), 'N/A') AS [Read (ms)]
			, ISNULL(CONVERT(VARCHAR(10), WriteMilliseconds), 'N/A') AS [Write (ms)]
			, TotalMilliseconds AS [Total (ms)]
		FROM #LatencyPercentiles
		WHERE Percentile IN (0, 25, 50, 75, 90, 95)
			OR Percentile >= 99;
END;

END;

GO
I decided to return data in two different ways, one very simple with aggregated data and another more granular with most the details you would find in the text version of the output.
The simplified version, which I recommend to store in a table for the future, will look like this.
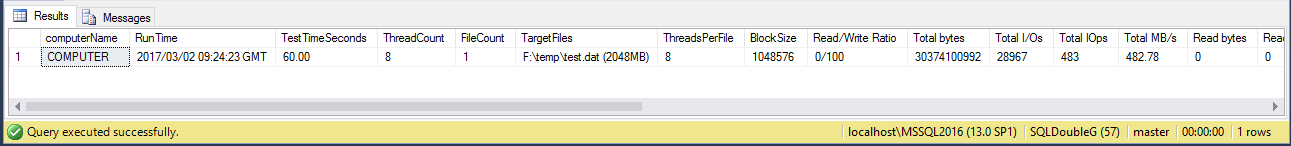
See how the performance it’s not too bad, in this case I’m interested in the throughput to the MB/s will tell me that. Since I run the test for only writes, the total will match the writes, otherwise will be the combination of reads and writes.
The extended version will look like this,
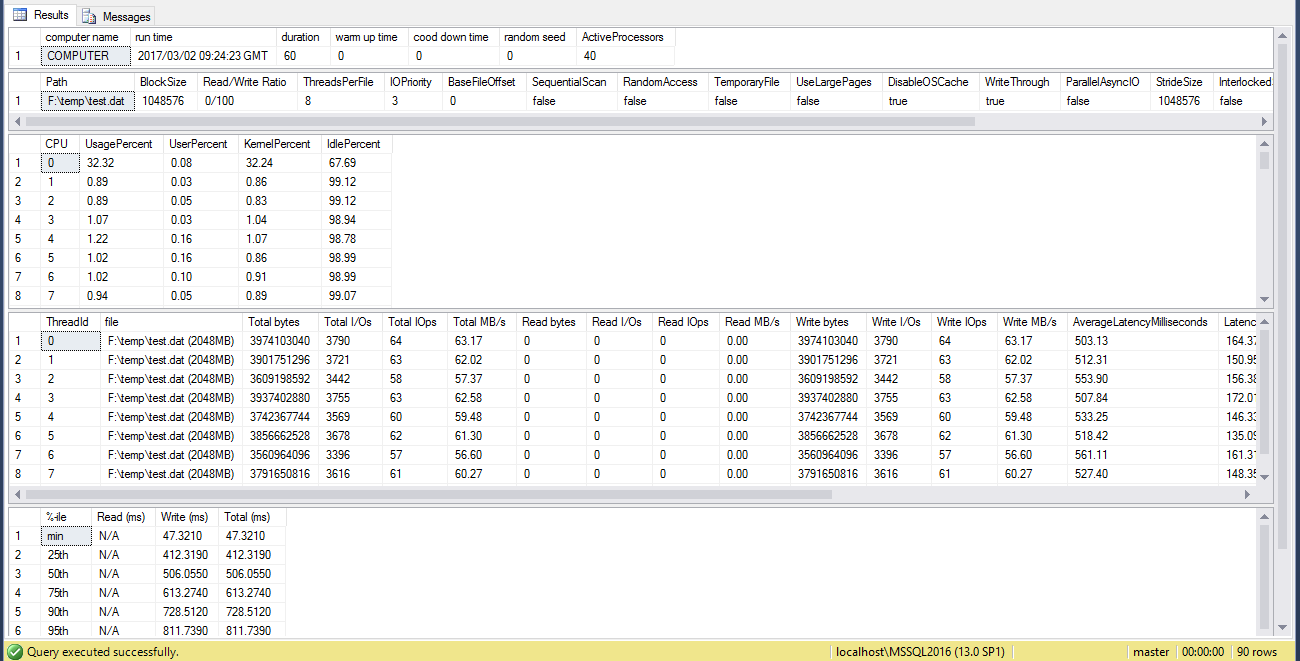
Obviously processing this output would be more laborious, but possible and will give you more insights of the test you have performed.
Conclusion
This has been a short post, but hopefully it will be useful for you to benchmark and monitor your storage subsystem.
Thanks for reading and any question, please use the comments below.
Hi Pedro, Did you ran the diskspd utility first and loading it in XML and later loading that data in SQL database using above code ? could you please elaborate on this
Thanks for your comment, the code above is meant to parse the XML output given by diskspd, so yes, you need to run diskspd.exe and specify the parameter -Rxml (see using diskspd paragraph)
Once you have the output file, you have to place it in your server (or a share where you can access from your SQL Server) and then run the stored procedure, which will parse the XML to return meaningful data you can keep for later analysis.
Cheers.
Hi Raul,
Great work, Thanks for the code, it’s working well. do you have the code for extended version as well ?
Thanks Harry, the SP contains both versions, you just need to call it using @simplified = 0 to get the multiple resultsets instead of 1.
Cheers
Great Script. It simply does the job. A real time-saver.
Thanks Andreas for your comment!, I’m pleased you find this useful.
Since you’re an expert in Extended Events you might also like my post https://sqldoubleg.live-website.com/2016/05/31/extended-events-file-target-reader/
Cheers!