In this post I want to show you how to create Data collectors in the Performance monitor and the different options we have to get the output and later on inserting in a SQL Server database It ain’t new year yet, but I have already made my resolutions and that include writing more, so I got to it.
When things go wrong, and by wrong mean anything that stops or slows down your production, we as DBA’s need to have data to back our words, so if we say SQL Server is as quick or slow as usual and you need to find your answers somewhere else, we need to have data to certainly prove it.
Background
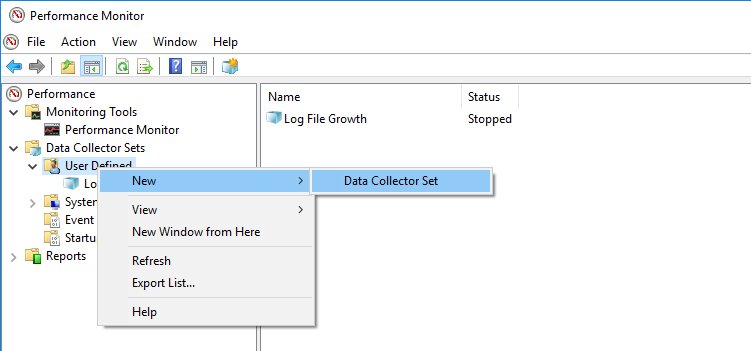
A great way to get performance metrics is built-in in the Windows OS, the performance monitor which allow us to create User Defined Data Collector Sets, you can just run perfmon.exe and it will bring the management console up for you.
We have so many counters to choose from and unfortunately explain each of them is out of the scope of this post, we will focus in how we are going to capture and most important how we are going to get them into SQL Server and then obtain meaningful results out of that data.
Creating a Data Collector based on a template
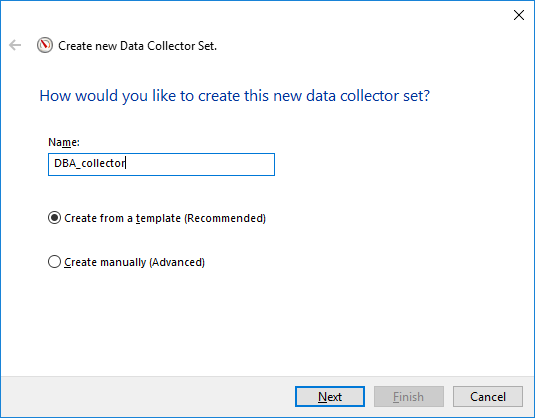
Once we have opened the performance monitor and attempted to create a new Data Collector we will need to make a few choices in the wizard.
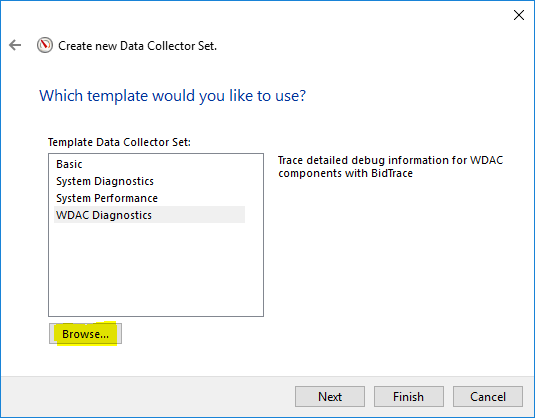
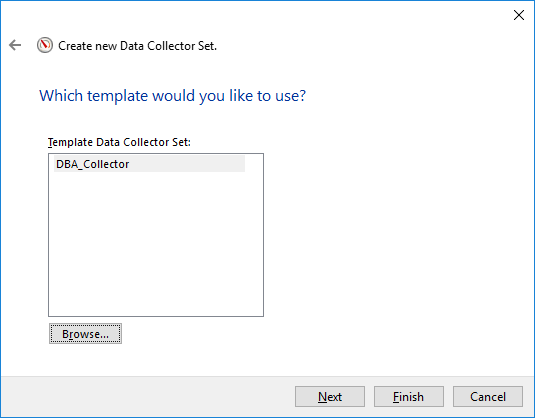
Here you have the template I have used to create my Data Collector, you just need to write it down to a XML file and change some of the counters which are related to SQL Server.
When I say MSSQL$MSSQL2016, that is because this counter refer to a named instance called MSSQL2016. If that was the default instance, it’d be just “SQL Server”.
Example: <Counter>\SQL Server:Buffer Manager\Page life expectancy</Counter>
Once you adjust it, you’re good to go.
<?xml version="1.0" encoding="UTF-16"?>
<DataCollectorSet>
	<Status>0</Status>
	<Duration>0</Duration>
	<Description>
	</Description>
	<DescriptionUnresolved>
	</DescriptionUnresolved>
	<DisplayName>
	</DisplayName>
	<DisplayNameUnresolved>
	</DisplayNameUnresolved>
	<SchedulesEnabled>-1</SchedulesEnabled>
	<Name>DBA_Collector</Name>
	<RootPath>C:\PerfLogs\Admin\DBA_collector</RootPath>
	<Segment>-1</Segment>
	<SegmentMaxDuration>86400</SegmentMaxDuration>
	<SegmentMaxSize>0</SegmentMaxSize>
	<SerialNumber>348</SerialNumber>
	<Server>
	</Server>
	<Subdirectory>
	</Subdirectory>
	<SubdirectoryFormat>3</SubdirectoryFormat>
	<SubdirectoryFormatPattern>yyyyMMdd\-NNNNNN</SubdirectoryFormatPattern>
	<Task>
	</Task>
	<TaskRunAsSelf>0</TaskRunAsSelf>
	<TaskArguments>
	</TaskArguments>
	<TaskUserTextArguments>
	</TaskUserTextArguments>
	<UserAccount>SYSTEM</UserAccount>
	<StopOnCompletion>0</StopOnCompletion>
	<PerformanceCounterDataCollector>
		<DataCollectorType>0</DataCollectorType>
		<Name>DataCollector01</Name>
		<FileName>DBA_DataCollector</FileName>
		<FileNameFormat>3</FileNameFormat>
		<FileNameFormatPattern>yyyyMMdd\_HHmmss</FileNameFormatPattern>
		<LogAppend>0</LogAppend>
		<LogCircular>0</LogCircular>
		<LogOverwrite>0</LogOverwrite>
		<DataSourceName>
		</DataSourceName>
		<SampleInterval>15</SampleInterval>
		<SegmentMaxRecords>0</SegmentMaxRecords>
		<LogFileFormat>3</LogFileFormat>
		<Counter>\Memory\Available MBytes</Counter>
		<Counter>\Paging File(*)\% Usage</Counter>
		<Counter>\MSSQL$MSSQL2016:Buffer Manager\Page life expectancy</Counter>
		<Counter>\MSSQL$MSSQL2016:Buffer Node(*)\Page life expectancy</Counter>
		<Counter>\MSSQL$MSSQL2016:General Statistics\User Connections</Counter>
		<Counter>\MSSQL$MSSQL2016:Memory Manager\Memory Grants Pending</Counter>
		<Counter>\MSSQL$MSSQL2016:SQL Statistics\Batch Requests/sec</Counter>
		<Counter>\MSSQL$MSSQL2016:SQL Statistics\SQL Compilations/sec</Counter>
		<Counter>\MSSQL$MSSQL2016:SQL Statistics\SQL Re-Compilations/sec</Counter>
		<Counter>\PhysicalDisk(*)\Avg. Disk Queue Length</Counter>
		<Counter>\PhysicalDisk(*)\Current Disk Queue Length</Counter>
		<Counter>\PhysicalDisk(*)\Disk Reads/sec</Counter>
		<Counter>\PhysicalDisk(*)\Disk Writes/sec</Counter>
		<Counter>\PhysicalDisk(*)\Avg. Disk sec/Read</Counter>
		<Counter>\PhysicalDisk(*)\Avg. Disk sec/Write</Counter>
		<Counter>\PhysicalDisk(*)\Avg. Disk Read Queue Length</Counter>
		<Counter>\PhysicalDisk(*)\Avg. Disk Write Queue Length</Counter>
		<Counter>\System\Processor Queue Length</Counter>
		<Counter>\Processor(*)\% Processor Time</Counter>
	</PerformanceCounterDataCollector>
	<DataManager>
		<Enabled>0</Enabled>
		<CheckBeforeRunning>0</CheckBeforeRunning>
		<MinFreeDisk>0</MinFreeDisk>
		<MaxSize>0</MaxSize>
		<MaxFolderCount>0</MaxFolderCount>
		<ResourcePolicy>0</ResourcePolicy>
		<ReportFileName>report.html</ReportFileName>
		<RuleTargetFileName>report.xml</RuleTargetFileName>
		<EventsFileName>
		</EventsFileName>
	</DataManager>
</DataCollectorSet>
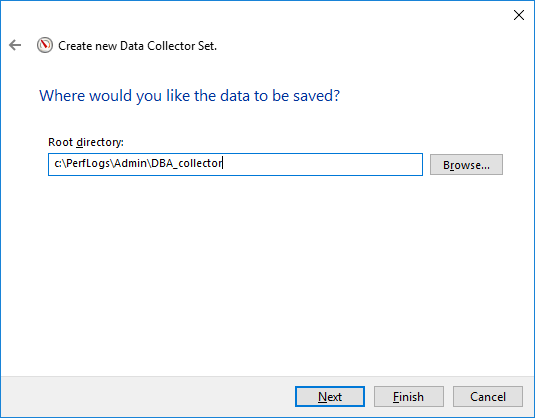
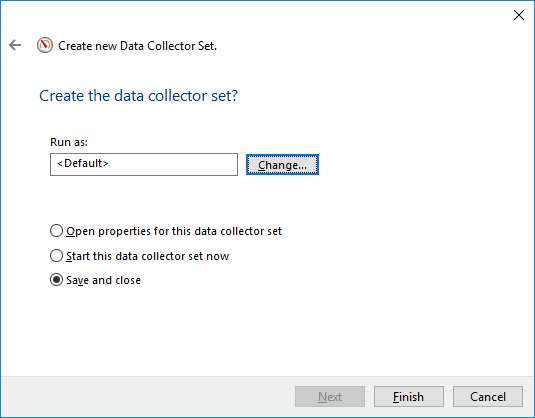
And after choosing the template (optional) or manually selected the counters, we need to decide where to store the output files and the credentials under it will run, you can leave the defaults there.
So we have now our Data collector created, we can go to properties to see how it looks like or maybe add more counters, who knows 🙂
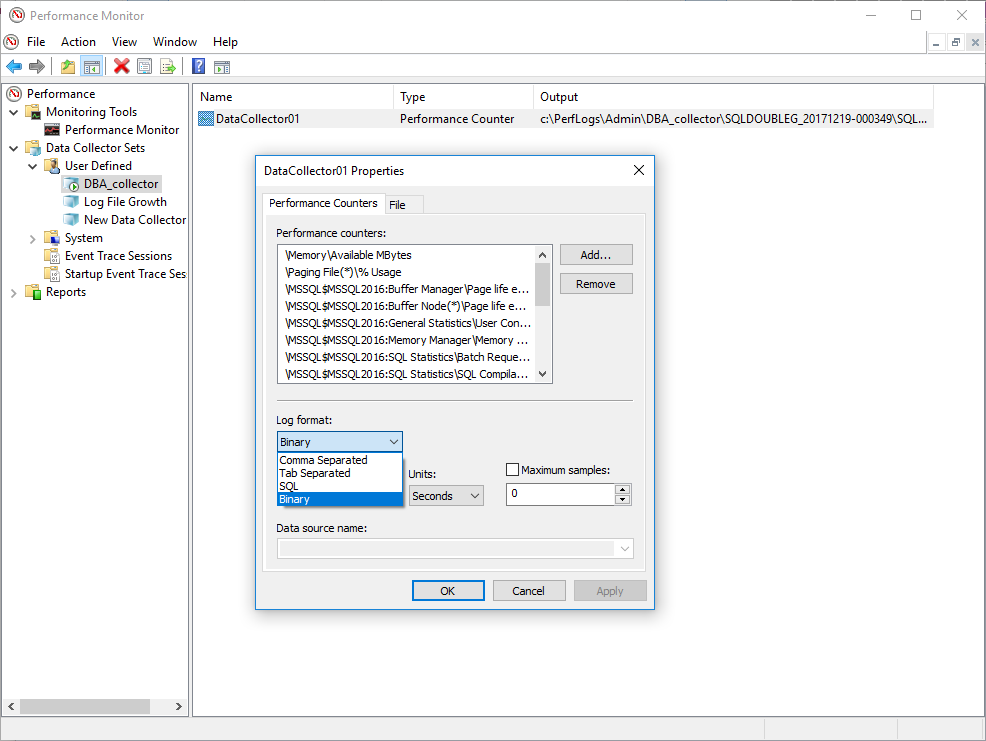
There are different options where to output all this data and it’s totally up to us to decide which one is best, but let me walk you through.
We have different options
- Comma Separated, the well known CSV file
- Tab Separated, mostly the same as above but tabs instead of commas
- SQL, this will write straight to a database we define
- Binary, create binary files
And each of them has some pros and cons
| Format | Storage Requirements | Can be open with | Can be imported to SQL |
| Comma Separated | Low | Spreadsheet software, text editor | Yes |
| Tab Separated | Low | Spreadsheet software, text editor | Yes |
| SQL | Database Only | SQL Server | Yes |
| Binary | High | Performance monitor | Yes |
How I see it is that really depends how you want to use the output apart from inserting it in a SQL Server database.
Comma separated and Tab separated are good if you want to open them with any spreadsheet software like Excel, also the storage requirements are less than binary files, in my experience about 1 to 4 for the same amount of data, so if that is your concern, plain text can be better.
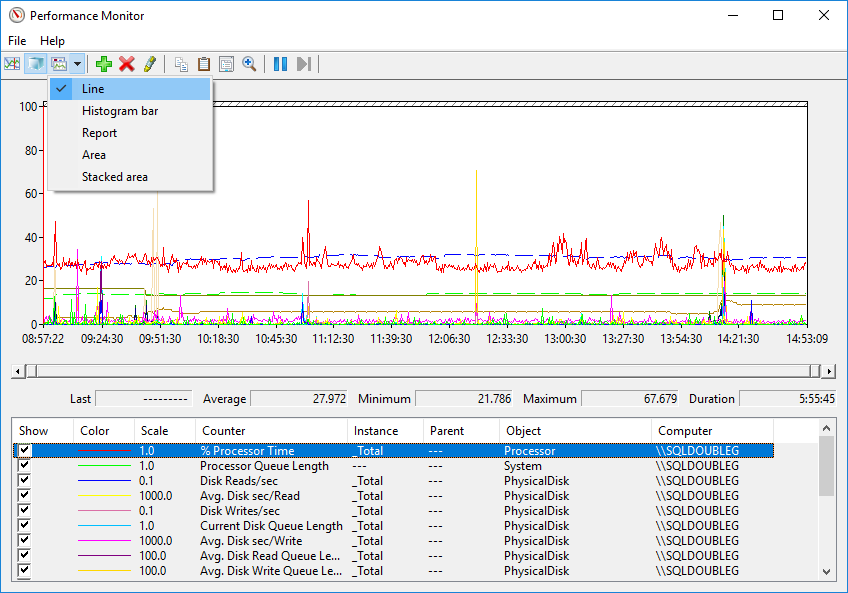
The binary format can be opened with the Performance Monitor and displays the different counters in a a variety of ways, just like when we see them live.
Inserting the data to a database might sound like the way to go, at the end of the day that is the purpose of this post, but unless we want to somehow process and aggregate that data, in no time it will be a lot of data, so I’d be careful, I rather have a lot of files in a fileshare and load into SQL just those which I have some interest than getting yet another monstrous database to maintain.
I chose to dump the data in a binary file so I can show you the output too, but definitely choose the one that suits you best.
Conclusion
So far we have seen how to create and configure a new Data Collector and the different outputs we can obtain from it.
It is very important to choose wisely the counters we want to monitor, because the amount of information can be overwhelming and can defeat the purpose.
And also we’ve seen how the different outputs can bring some pros and cons, so again we need to think carefully what how we want to consume them. This can be changed at any time though so if you see the format you chose back when you created it does not work for you, just go change it.
For now that is all, next week we’ll see how we can get all this data into SQL Server and then how to process it to get the data back in a more meaningful way.
Hope you enjoy the reading and stay tuned for the second part!
Thanks.