This week we will retake my last’s post topic to finish that job off and get in and out our Perfmon data to and from our SQL Server. This week we will retake my last’s post topic and finished that job off and get our Perfmon in and out data of our SQL Server.
For now, we have just seen how to collect Perfmon data and the different formats we can store that in both, files and SQL but without actually putting any data into SQL if that makes sense.
In order to be able to insert into SQL Server, we have a tool called relog.exe that will do the job for us with some minimal configuration, let me show you how to do this.
Before using relog.exe, create a DSN
Relog is an application and as such it might be able to connect to a SQL Server. In this case, the way to connect is via ODBC driver, hence we have to create a new DSN in the computer we want to run Relog.exe, which does not have to be necessarily the same server where SQL is installed.
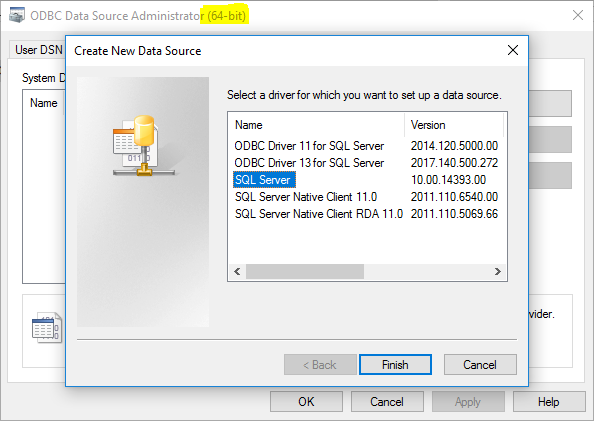
If we click Start and start typing ODBC it’ll show the 2 versions available in modern OS’s which are 32bit and 64bit, we need to choose the 64bit version to make it work.
Seems like being relog.exe a bit old, the only driver that actually works is the oldest, but whatever, it works!, so we choose the SQL Server 10.00.xxx one.
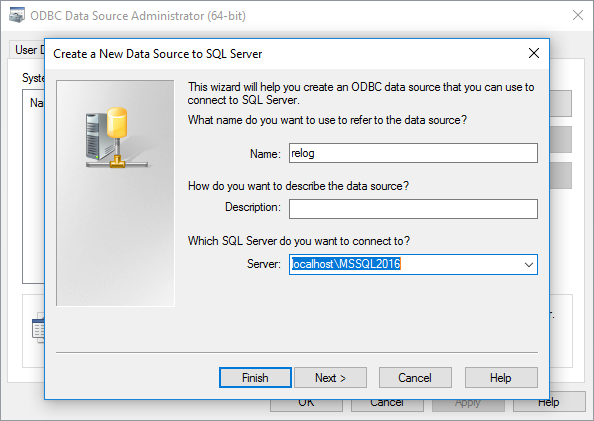
We then have to configure the new DSN following the wizard, first the name we will use later when executing relog.exe
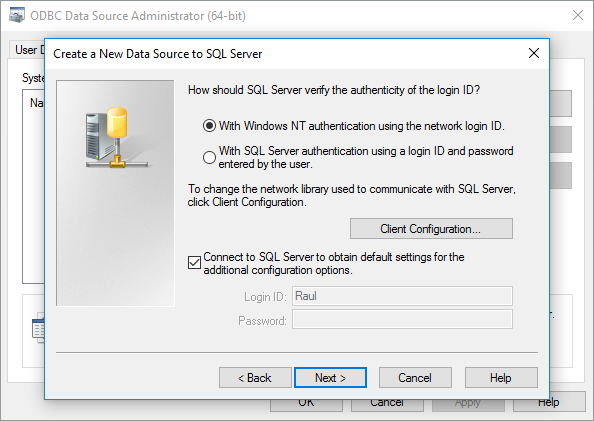
Then the security, not big deal here.
And then select the database where to dump the data, better to prepare one in advanced and not to leave the default [master] here.
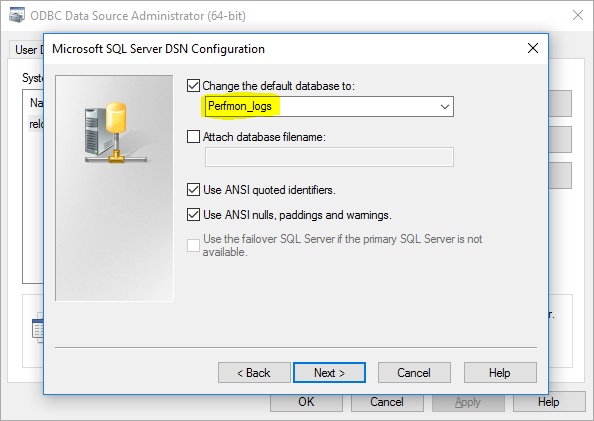
Some other settings I don’t change
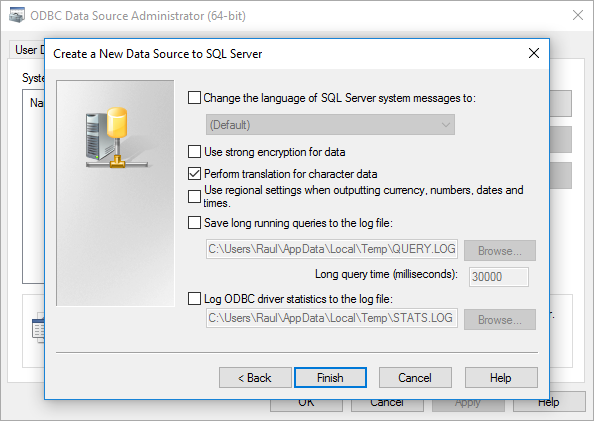
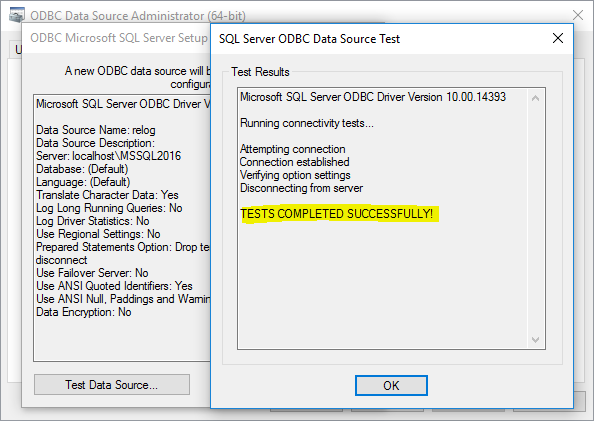
And finally test the connectivity, which obviously has to be successful.
Now we are ready to run relog.exe and insert all those counters in our database.
Before using relog.exe, limiting the amount of data
It might happen you have all kind of counters (be honest, we are data hoarders), but you are only interested in a small subset, so why would you load everything in the database if you don’t need it? Simple, do not load everything if you don’t need it.
The parameters you can use to limit the amount of data are:
- -cf, to specify just certain counters from your file. You need to create a file and write there one counter per line, you can use the XML template to see the counters,
and strip off the XML tags - -t, it will take one per each number you put here, so if let’s say you have 100 rows in your file and here you say 2, you will get 50 rows back, if you say 4, then 25 rows back and so on.
- -b and -e, those will define a time window for the counter, so if you need data only from 1:53am to 2:17am when you have some problem, you can do that too.
From my XML template, if I just want to see SQL counters, I’d do
\MSSQL$MSSQL2016:Buffer Manager\Page life expectancy
\MSSQL$MSSQL2016:Buffer Node(*)\Page life expectancy
\MSSQL$MSSQL2016:General Statistics\User Connections
\MSSQL$MSSQL2016:Memory Manager\Memory Grants Pending
\MSSQL$MSSQL2016:SQL Statistics\Batch Requests/sec
\MSSQL$MSSQL2016:SQL Statistics\SQL Compilations/sec
\MSSQL$MSSQL2016:SQL Statistics\SQL Re-Compilations/sec
and then specify the path of this file when calling relog, otherwise all counters will be included.
What if I do not want to use relog.exe
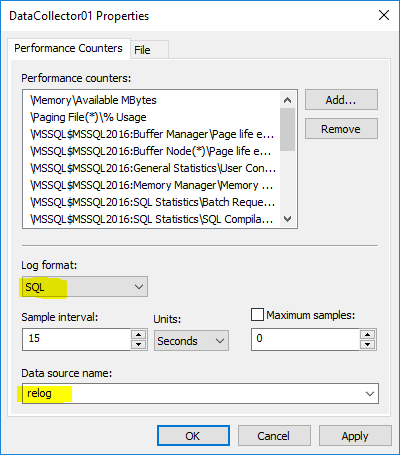
Ok, I said I wouldn’t do it, but if you want to get the perfmon data straight into SQL, then you can modify the Data collector to do so.
Just need to go to the data collector properties and choose SQL as Log Format, then choose the DSN we just created in the box.
That will write into SQL continuously.
Running relog.exe
There is not very complicated and I have explained some parameters you can use, but you can see the documentation here to get the full reference.
You obviously need to specify the file to be process and in our case, the database settings to make it work.
- -f, specifies the output format, SQL
- -o, specifies the path of the output file, in our case the format is SQL:DNS_name!SQLServerName.
In my example it’d be SQL:relog!localhost\MSSQL2016, but to be honest instead of the server name you can put whatever you want, because the server name is specified in the DSN already
And that’s good to go.
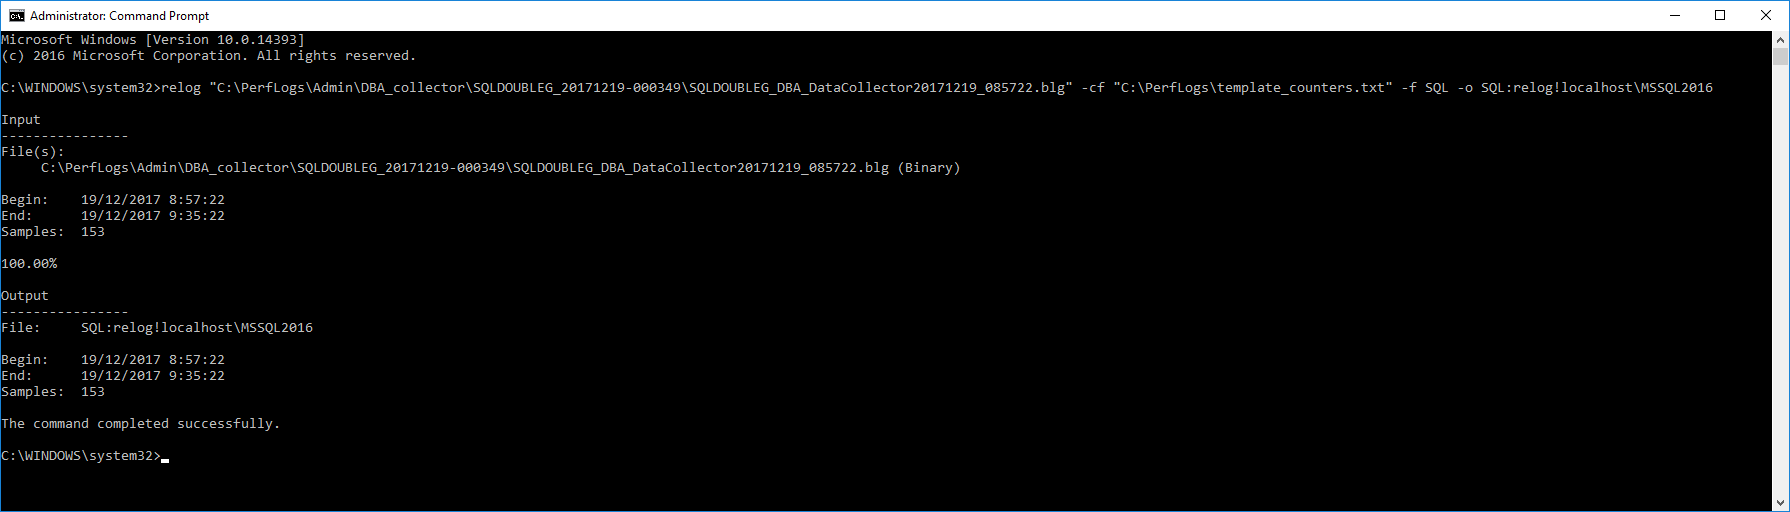
C:\WINDOWS\system32>relog "C:\PerfLogs\Admin\DBA_Collector\SQLDOUBLEG_20171221-000348\SQLDOUBLEG_DBA_DataCollector20171221_104025.blg" -cf "C:\PerfLogs\template_counters.txt" -f SQL -o SQL:relog!localhost\MSSQL2016
After running this, you should see something like this
If you see any kind of error related to SQL like “A SQL failure occurred. Check the application event log for any errors.” double check that you created the DSN as explained above.
Perfmon Data in SQL Server
After running successfully relog.exe with SQL as destination we should have the new tables in the database we have specified in our DSN
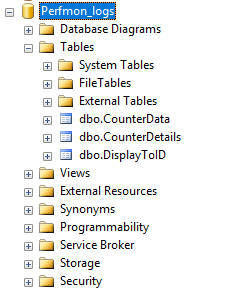
The data is distributed in the following way
- CounterData, these are the values for the different counters
- CounterDetails, the different counters included in the log file we loaded
- DisplayToID, the different machine[s] we have loaded information from
The Hack
And finally after all this, we are here, we have the data loaded in SQL Server and we want to display it.
In my opinion the best way to visualize this data is in the same way we can do in Excel, that is displaying one counter per column so the different values for a given point in time are in the same row, but that is not how the data is stored in [CounterData] so we have to process the data and (drum roll) Pivot it 🙁
Seems like every hack I publish involves the kind of queries I hate the most writing, either XML or PIVOT, and that makes a lot of sense, because I want to save you the pain of writing these queries.
So I must get them to be as flexible as possible, afterwards you can always modify them if you like.
Because I don’t know which counters will be present in these tables or even what names they have (remember SQL Counters depend on the instance name or the OS related like processor where you get a counter per thread), we need to dynamically get those values (counters) to then use PIVOT and transform them into the different columns.
Although I showed you how to filter the files when inserting into SQL, I also added a parameter to filter them again from the tables, just to give more flexibility.
USE [master];
GO
IF OBJECT_ID('dbo.sqlg_parseRelogOutput') IS NULL EXECUTE sp_executesql N'CREATE PROCEDURE dbo.sqlg_parseRelogOutput AS RETURN';
GO
SET ANSI_NULLS ON;
GO
SET QUOTED_IDENTIFIER ON;
GO
-- =============================================
-- Author: Raul Gonzalez @SQLDoubleG
-- Create date: 18/12/2017
-- Description: Formats the output generated by relog.exe and exists in the following tables.
-- - CounterData
-- - CounterDetails
-- - DisplayToID
--
-- Parameters:
-- @dbname -> Name of the database where the Perfmon data exist
-- @CounterFilter -> To select only the counters that match the filter
--
-- Usage: Call this stored proc and provide the name of the database where your perfmon logs have been loaded
-- It is recommended not to run in the same server we are trying to analyze due to the
-- amount of resources used by this query
--
-- EXECUTE master.[dbo].[sqlg_parseRelogOutput] N'Perfmon_logs', N'Processor';
--
-- Assumptions: You have loaded perfmon information using relog as explained in
-- https://sqldoubleg.live-website.com/2017/12/20/getting-perfmon-data-into-sql-server/
--
-- Change Log: 18/12/2017 RAG Created
--
-- Copyright: (C) 2017 Raul Gonzalez (@SQLDoubleG https://sqldoubleg.live-website.com)
--
-- THIS CODE AND INFORMATION ARE PROVIDED "AS IS" WITHOUT WARRANTY OF
-- ANY KIND, EITHER EXPRESSED OR IMPLIED, INCLUDING BUT NOT LIMITED
-- TO THE IMPLIED WARRANTIES OF MERCHANTABILITY AND/OR FITNESS FOR A
-- PARTICULAR PURPOSE.
--
-- THE AUTHOR SHALL NOT BE LIABLE TO YOU OR ANY THIRD PARTY FOR ANY INDIRECT,
-- SPECIAL, INCIDENTAL, PUNITIVE, COVER, OR CONSEQUENTIAL DAMAGES OF ANY KIND
--
-- YOU MAY ALTER THIS CODE FOR YOUR OWN *NON-COMMERCIAL* PURPOSES. YOU MAY
-- REPUBLISH ALTERED CODE AS LONG AS YOU INCLUDE THIS COPYRIGHT AND GIVE DUE CREDIT.
--
-- =============================================
ALTER PROCEDURE [dbo].[sqlg_parseRelogOutput]
@dbname sysname
, @CounterFilter NVARCHAR(256) = NULL
AS
BEGIN
DECLARE @column_list NVARCHAR(MAX);
DECLARE @pivot_list NVARCHAR(MAX);
DECLARE @SQL NVARCHAR(MAX);
DECLARE @RC INT;
IF DB_ID(@dbname) IS NULL BEGIN
RAISERROR (N'The database provided does not exist', 16, 1, 1);
RETURN -100;
END;
-- Get the different perfmon counters to be new columns for the output
SET @SQL = N'USE ' + QUOTENAME(@dbname) + N'
IF OBJECT_ID(''dbo.CounterData'') IS NULL OR OBJECT_ID(''dbo.CounterDetails'') IS NULL BEGIN
RAISERROR (N''The Relog generated tables are not present on this database, please ensure that [dbo].[CounterData], [dbo].[CounterDetails] and [dbo].[DisplayToID] exist'', 16, 1, 1)
RETURN
END
SET @column_list = (SELECT DISTINCT N'', '' + QUOTENAME(CONCAT([ObjectName], CHAR(92), [CounterName], NULLIF(CONCAT(N'' ('', InstanceName, N'')''),N'' ()'' ))) AS [text()]
FROM [dbo].[CounterDetails]
WHERE [CounterName] LIKE CONCAT(N''%'', @CounterFilter + N''%'')
FOR XML PATH(''''))
SET @pivot_list = (STUFF(@column_list, 1, 2, ''''))';
EXECUTE @RC = sys.sp_executesql
@stmt = @SQL
, @params = N'@column_list NVARCHAR(MAX) OUTPUT,@pivot_list NVARCHAR(MAX) OUTPUT, @CounterFilter NVARCHAR(256)'
, @column_list = @column_list OUTPUT
, @pivot_list = @pivot_list OUTPUT
, @CounterFilter = @CounterFilter;
IF @RC <> 0 BEGIN
RETURN @RC;
END;
-- Now generate the the query with the right values to PIVOT and get the data out
SET @SQL = N'USE ' + QUOTENAME(@dbname) + N'
SELECT [ComputerName]
, [CounterDateTime]
' + @column_list + N'
FROM (
SELECT CONCAT(det.[ObjectName], CHAR(92), det.[CounterName], NULLIF(CONCAT('' ('', det.InstanceName, '')''),'' ()'' )) AS PermonCounter
,did.[DisplayString] AS [ComputerName]
,dat.[CounterDateTime] AS [CounterDateTime]
,dat.[CounterValue]
FROM [dbo].[CounterData] AS dat
LEFT JOIN [dbo].[CounterDetails] AS det
ON det.CounterID = dat.CounterID
LEFT JOIN [dbo].[DisplayToID] AS did
ON did.[GUID] = dat.[GUID]
WHERE det.[CounterName] LIKE CONCAT(N''%'', @CounterFilter + N''%'')
) AS s
PIVOT(
SUM([CounterValue])
FOR [PermonCounter] IN (' + @pivot_list + ' )) AS pvt
ORDER BY [CounterDateTime] ASC';
EXECUTE @RC = sys.sp_executesql
@stmt = @SQL
, @params = N'@CounterFilter NVARCHAR(256)'
, @CounterFilter = @CounterFilter;
IF @RC <> 0 BEGIN
RETURN @RC;
END;
END;
GO
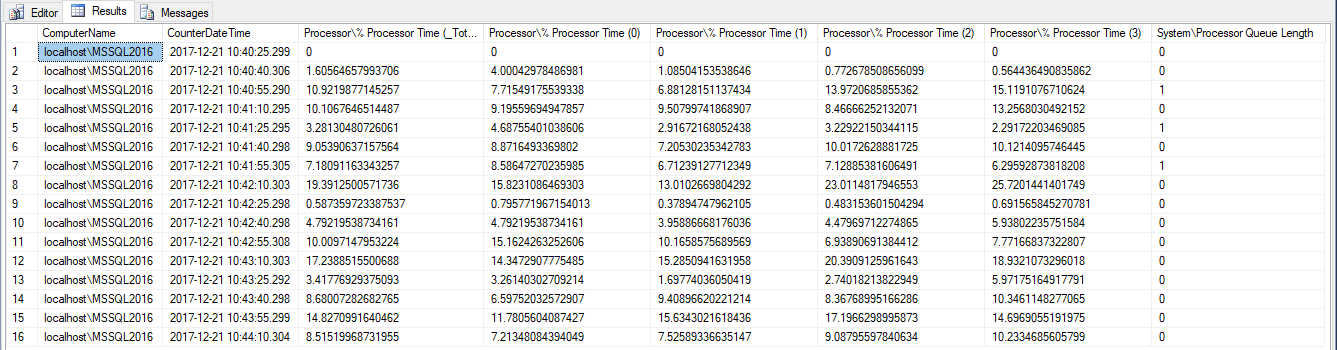
EXECUTE master.[dbo].[sqlg_parseRelogOutput] N'Perfmon_logs', N'Processor';
If we run the example proposed the output would be something like this.
Conclusion
As I said in the first part of this post, it is important to have a picture of how our SQL Servers look like in a normal state, how busy they are and perform, in case something happens and everyone points at them. And believe me, first place everyone points is to the database, regardless it’s the one to blame or not.
Hopefully these have given you some ideas to start collecting performance data y help you visualize when fingers start pointing.
Thanks for reading and as usual, any comment on questions are welcome.